Successful trading is not about guesswork or emotions—it’s about data, structure, and discipline. One of the most powerful tools traders use to analyze the market and improve decision-making is trading indicators. Whether you trade stocks, forex, crypto, or commodities, understanding indicators can significantly improve your trading performance.
In this blog, we’ll break down what trading indicators are, how they work, and how traders use them effectively.
4
What Are Trading Indicators?
Trading indicators are mathematical calculations based on price, volume, or open interest. They are displayed on trading charts and help traders identify market trends, momentum, volatility, and potential entry or exit points.
Indicators do not predict the future—but they increase probability by helping traders interpret market behavior.
Why Trading Indicators Matter
Trading indicators help traders:
- Identify market trends
- Measure momentum and strength
- Spot overbought and oversold conditions
- Confirm trade entries and exits
- Reduce emotional decision-making
Used correctly, indicators act as a decision-support system rather than a signal to trade blindly.
Types of Trading Indicators
1. Trend Indicators
Trend indicators help traders determine the direction of the market.
Popular trend indicators:
- Moving Averages (SMA & EMA)
- MACD (Moving Average Convergence Divergence)
- Parabolic SAR
📌 Best for: Trending markets
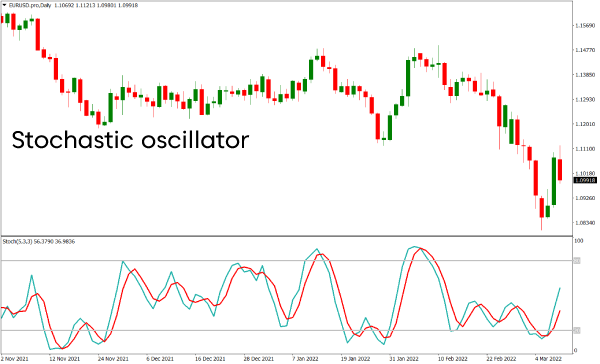
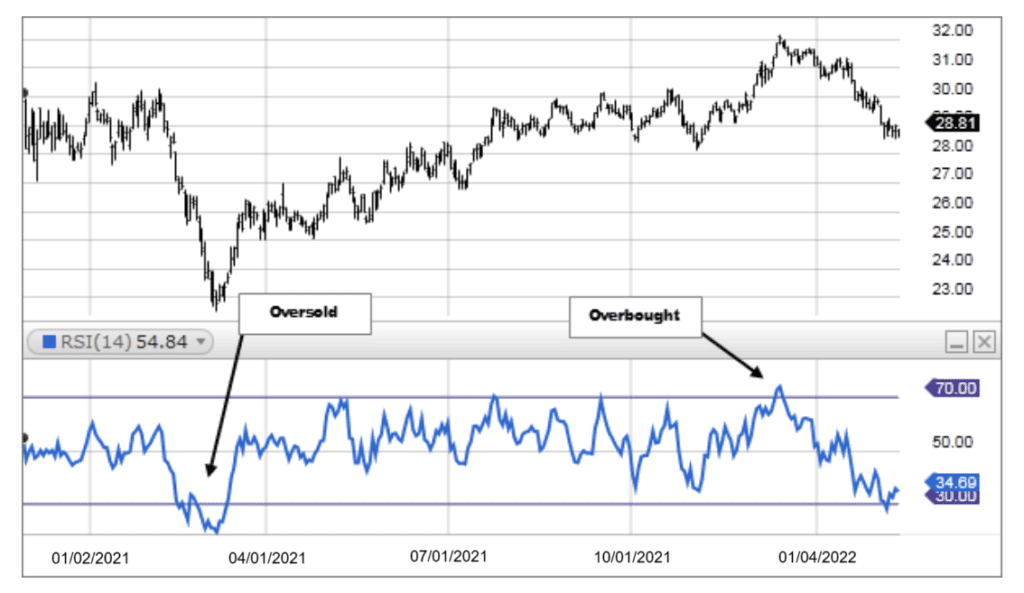
2. Momentum Indicators
Momentum indicators measure the speed and strength of price movements.
Common momentum indicators:
- RSI (Relative Strength Index)
- Stochastic Oscillator
- CCI (Commodity Channel Index)
📌 Best for: Identifying reversals and momentum shifts
3. Volatility Indicators
These indicators show how much the price is expanding or contracting.
Popular volatility indicators:
- Bollinger Bands
- Average True Range (ATR)
📌 Best for: Breakout and risk management strategies
4. Volume Indicators
Volume indicators analyze trading activity and confirm price movements.
Examples include:
- On-Balance Volume (OBV)
- Volume Oscillator
- Accumulation/Distribution Line
📌 Best for: Confirming trend strength
How to Use Trading Indicators Effectively
✅ Combine Indicators Wisely
Avoid using too many indicators at once. A common strategy is:
- 1 trend indicator
- 1 momentum indicator
- 1 volume or volatility indicator
✅ Match Indicators to Market Conditions
- Use trend indicators in trending markets
- Use momentum indicators in sideways markets
✅ Always Use Risk Management
Indicators should be combined with:
- Stop-loss orders
- Proper position sizing
- A clear trading plan
Common Mistakes Traders Make
- ❌ Relying on a single indicator
- ❌ Overloading charts with indicators
- ❌ Ignoring price action
- ❌ Using indicators without a strategy
Remember: Indicators support decisions—they don’t replace skill or discipline.
Final Thoughts
Trading indicators are powerful tools when used correctly. They help traders understand market behavior, manage risk, and trade with confidence. However, no indicator works perfectly in every market condition. The key to success lies in practice, strategy development, and consistency.
If you’re serious about trading, start by mastering a few indicators, testing them in demo accounts, and refining your approach over time.