What Is the Relative Strength Index (RSI)?
The Relative Strength Index (RSI) is a widely used technical analysis indicator that measures the momentum of price movements. It helps traders determine whether an asset is overbought, oversold, or moving within a healthy trend.
Developed by J. Welles Wilder, RSI is commonly applied in stocks, forex, cryptocurrency, and commodities trading. Because of its simplicity and effectiveness, RSI is often the first indicator beginners learn.
How Does RSI Work?
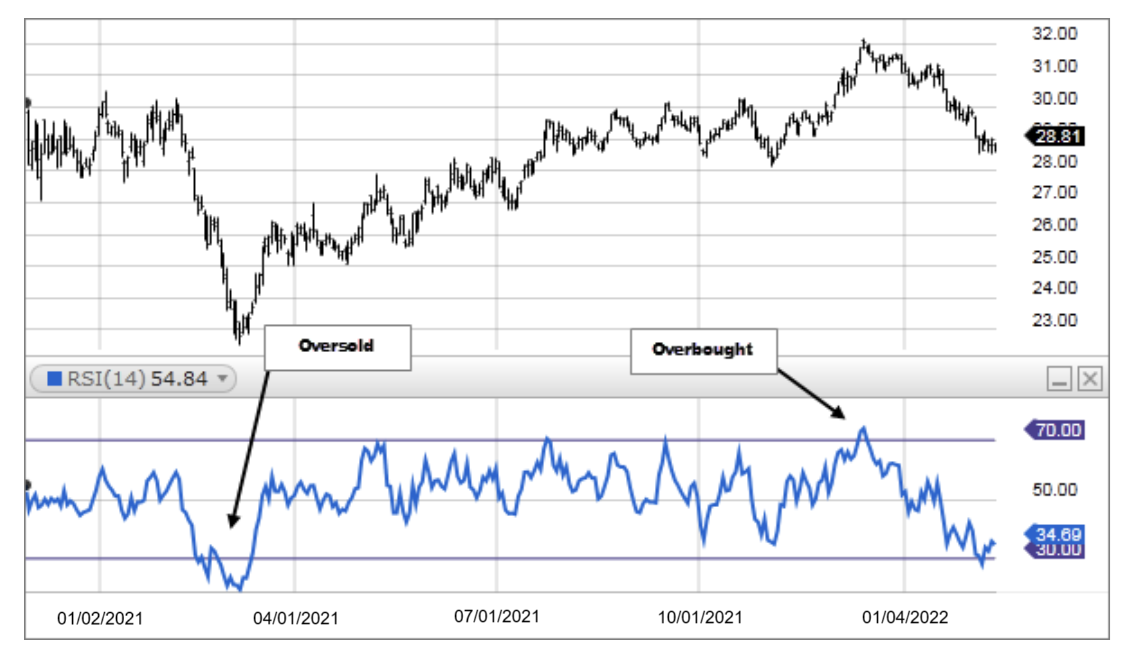
RSI oscillates between 0 and 100, reflecting the strength of recent price changes.
Key RSI Levels
- RSI above 70 → Overbought condition
- RSI below 30 → Oversold condition
- RSI between 30 and 70 → Neutral zone
The most commonly used setting is RSI (14), which works well across most markets and timeframes.
RSI Formula (Beginner-Friendly Explanation)
RSI compares the average gains and average losses over a specific period.
RSI = 100 − [100 / (1 + RS)]
You don’t need to calculate this manually—trading platforms do it automatically. What’s important is interpreting RSI correctly, not the math.
How to Use RSI in Trading
1. RSI Overbought & Oversold Strategy
This is the most popular RSI trading method.
- Buy Signal: RSI moves up from below 30
- Sell Signal: RSI moves down from above 70
📌 Best used in range-bound markets.
⚠️ Avoid blindly selling just because RSI is above 70 in strong uptrends.
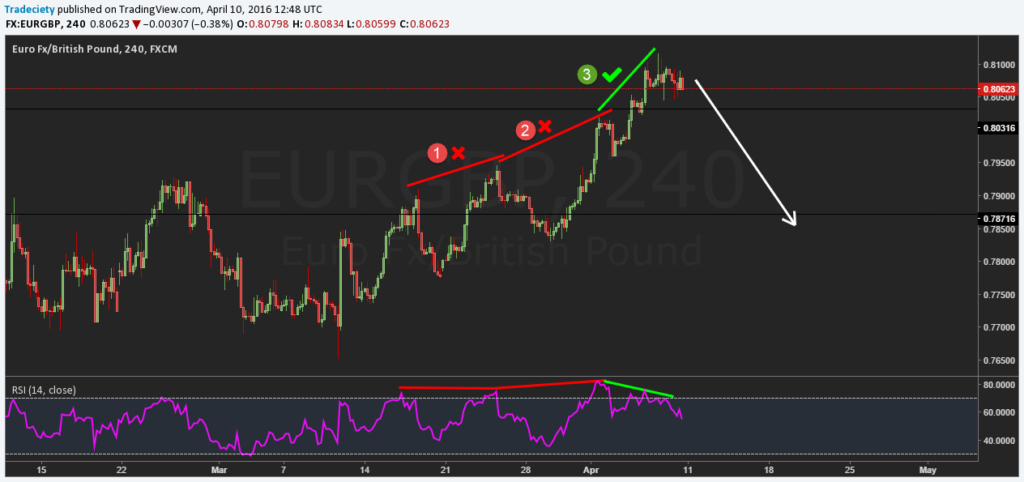
2. RSI Divergence (High-Accuracy Signal)
RSI divergence occurs when price action and RSI move in opposite directions.
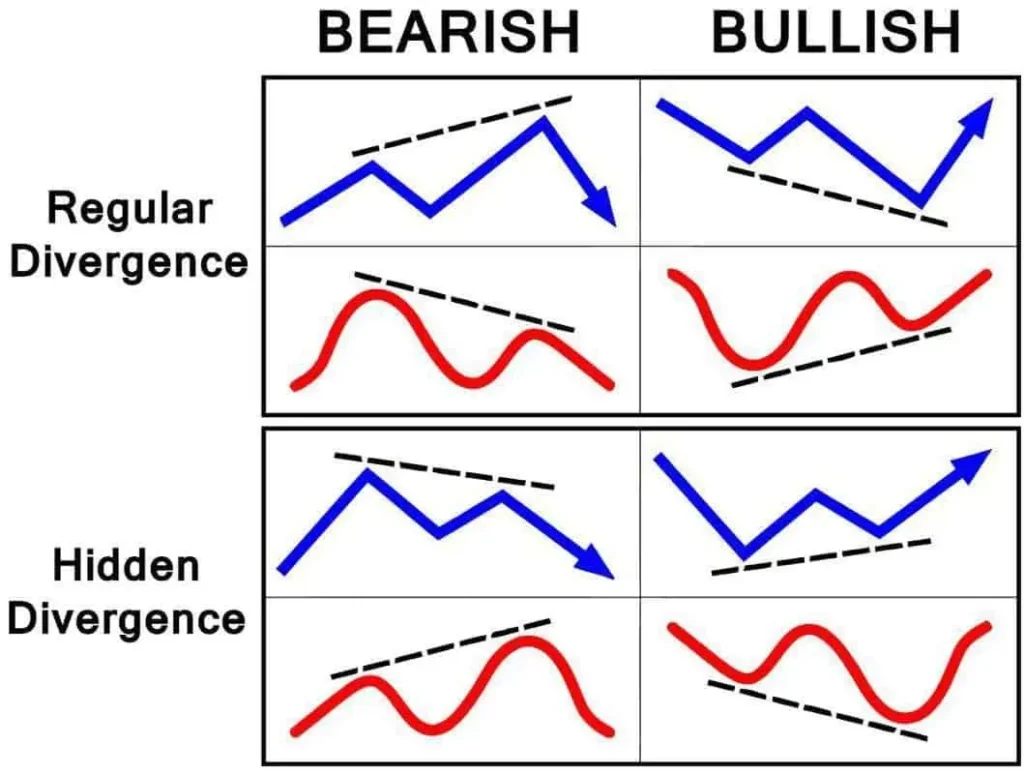
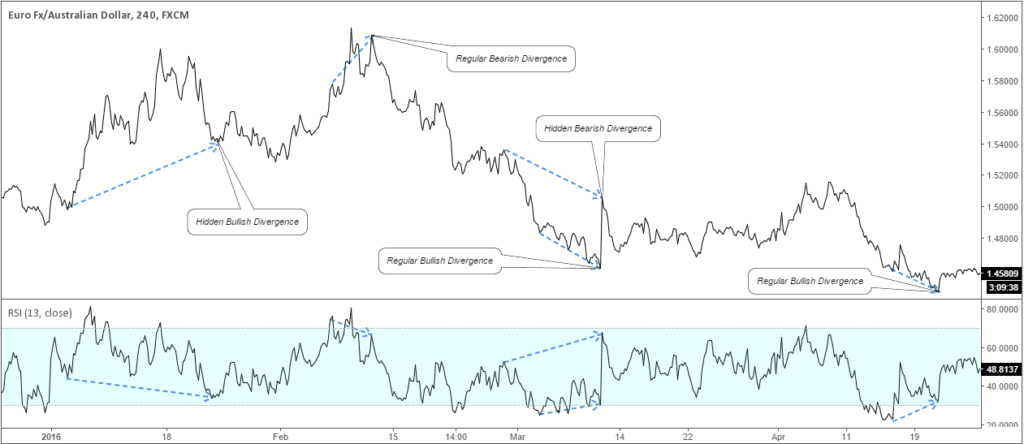
Types of RSI Divergence
- Bullish Divergence:
Price makes lower lows, RSI makes higher lows → Possible upward reversal - Bearish Divergence:
Price makes higher highs, RSI makes lower highs → Possible downward reversal
RSI divergence is especially powerful when combined with support and resistance levels.
3. RSI Trend Confirmation Strategy
RSI can also help confirm market trends.
- In a strong uptrend, RSI usually stays above 40
- In a strong downtrend, RSI usually stays below 60
This helps traders avoid false buy or sell signals during trending markets.
Best RSI Settings for Different Trading Styles
| Trading Style | Recommended RSI Period |
|---|---|
| Scalping | 7–9 |
| Day Trading | 14 |
| Swing Trading | 14–21 |
| Long-Term Investing | 21–28 |
👉 Pro Tip: Beginners should stick with RSI (14) until they gain experience.
Advantages of RSI Indicator
✅ Easy to understand
✅ Works in all markets
✅ Identifies momentum & reversals
✅ Ideal for beginners
✅ Available on all trading platforms
Limitations of RSI
❌ Can give false signals in strong trends
❌ Overbought does not always mean price will fall
❌ Should not be used alone
📌 Best Practice: Combine RSI with:
- Moving Averages
- Support & Resistance
- Trendlines
- Volume indicators
RSI vs Other Indicators
- RSI vs MACD: RSI is faster, MACD is better for trend strength
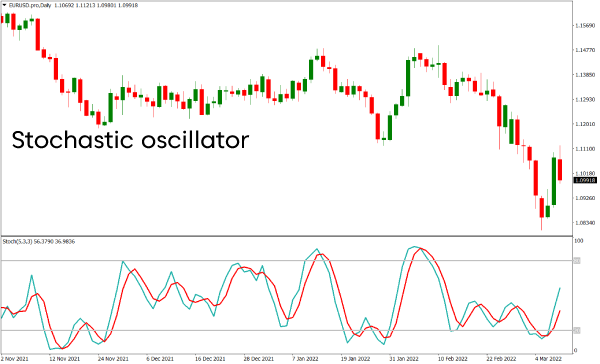
- RSI vs Stochastic: RSI is smoother and less noisy
- RSI vs Moving Average: RSI shows momentum, MA shows trend
Many professional traders use RSI + Moving Average for better accuracy.
Common RSI Trading Mistakes
❌ Trading RSI without trend confirmation
❌ Ignoring divergence signals
❌ Using RSI alone
❌ Selling too early in strong uptrends
Avoiding these mistakes can dramatically improve your results.
Is RSI Good for Beginners?
Yes—RSI is one of the best indicators for beginners because:
- It’s visual and easy to read
- It teaches momentum concepts
- It works across all markets
Mastering RSI builds a strong foundation for learning advanced technical analysis.
Final Thoughts
The Relative Strength Index (RSI) is a powerful yet simple tool that every trader should understand. While it’s not perfect on its own, RSI becomes extremely effective when combined with proper market structure and risk management.
If you’re serious about trading, RSI should be part of your core strategy.
RSI FAQs.
❓ What is RSI in trading?
RSI (Relative Strength Index) is a momentum indicator that measures the speed and strength of price movements to identify overbought and oversold conditions.
❓ Is RSI good for beginners?
Yes. RSI is one of the best indicators for beginners because it is easy to understand, visual, and works across all markets.
❓ What is the best RSI setting?
- Default & Best: RSI (14)
- Scalping: RSI (7–9)
- Swing trading: RSI (14–21)
❓ Is RSI better than MACD?
RSI is faster and better for spotting reversals, while MACD is better for identifying trend strength. Many traders use both together.
❓ Can RSI be used alone?
RSI can be used alone, but it performs best when combined with:
- Trend indicators
- Support & resistance
- Moving averages
❓ Why does RSI stay overbought or oversold?
In strong trends, RSI can remain above 70 or below 30 for long periods. This is normal and does not mean price will immediately reverse.
❓ Does RSI work in crypto trading?
Yes. RSI works extremely well in crypto markets due to strong momentum and volatility.
❓ Which timeframe is best for RSI?
RSI works on all timeframes:
- Scalpers → 1m–5m
- Day traders → 15m–1H
- Swing traders → 4H–Daily
Final Thoughts
The Relative Strength Index (RSI) is a powerful yet simple indicator that every trader should master. When combined with trend direction and proper risk management, RSI can deliver high-quality trade setups across all markets.
If you want consistent results, don’t just learn RSI—learn how to use it correctly.